Getting Started
This tutorial will walk you through using ros2_medkit to discover and interact with ROS 2 nodes through the REST API gateway.
Overview
ros2_medkit provides a REST API gateway that exposes your ROS 2 system for external tools, web interfaces, and remote diagnostics. In this tutorial, you will:
Launch the gateway with demo nodes
Discover areas and components
Read sensor data via REST API
Call services and manage parameters
Monitor and clear faults
Prerequisites
ros2_medkit installed (see Installation)
Terminal with ROS 2 environment sourced
curlor a REST client (Postman recommended)
Step 1: Launch the Gateway
Open three terminals. In each, source your workspace:
source ~/ros2_medkit/install/setup.bash
Terminal 1 - Start the gateway:
ros2 launch ros2_medkit_gateway gateway.launch.py
You should see:
[gateway_node]: REST server starting on http://127.0.0.1:8080
[gateway_node]: REST server started successfully
Terminal 2 - Start demo nodes:
ros2 launch ros2_medkit_integration_tests demo_nodes.launch.py
This launches automotive demo nodes from the integration tests package that we’ll use to explore the API.
Node Name |
Entity ID |
Namespace |
Description |
|---|---|---|---|
temp_sensor |
powertrain_engine_component.temp_sensor |
/powertrain/engine |
Engine temperature sensor |
rpm_sensor |
powertrain_engine_component.rpm_sensor |
/powertrain/engine |
Engine RPM sensor |
calibration |
powertrain_engine_component.calibration |
/powertrain/engine |
Calibration service (sync) |
long_calibration |
powertrain_engine_component.long_calibration |
/powertrain/engine |
Long calibration action (async) |
pressure_sensor |
chassis_brakes_component.pressure_sensor |
/chassis/brakes |
Brake pressure sensor |
actuator |
chassis_brakes_component.actuator |
/chassis/brakes |
Brake actuator |
status_sensor |
body_door_front_left_component.status_sensor |
/body/door/front_left |
Door status sensor |
controller |
body_lights_component.controller |
/body/lights |
Light controller |
lidar_sensor |
perception_lidar_component.lidar_sensor |
/perception/lidar |
LiDAR sensor with faults |
Note
In runtime-only discovery mode, entity IDs are derived from the namespace path.
Use the /components endpoint to discover actual component IDs.
Terminal 3 - (Optional) Start fault manager:
mkdir -p $HOME/.ros2_medkit
ros2 run ros2_medkit_fault_manager fault_manager_node --ros-args -p database_path:=$HOME/.ros2_medkit/faults.db
Required if you want to test the Faults API.
Note
The ~/.ros2_medkit/ directory must exist before starting the fault manager.
SQLite will create the database file automatically.
✅ Checkpoint
At this point you should have:
Gateway running on http://localhost:8080
Demo nodes publishing data
Terminal 1 showing:
[gateway_node]: REST server started successfully
Step 2: Explore the API
The gateway exposes all endpoints under /api/v1. Let’s explore!
Check gateway health:
curl http://localhost:8080/api/v1/health
Get gateway capabilities:
curl http://localhost:8080/api/v1/
Response shows available endpoints and version info.
✅ Checkpoint
Health check should return: {"status": "healthy", "timestamp": ...}
If you see connection refused, verify gateway is running.
Step 3: Discover Areas and Components
ros2_medkit organizes ROS 2 nodes into a SOVD-aligned entity hierarchy:
Areas - Logical/physical domains (e.g.,
/powertrain,/chassis)Components - Hardware or virtual units that group Apps
Apps - Individual ROS 2 nodes
Functions - Cross-cutting capabilities (requires manifest mode)
Note
Discovery Modes
Runtime-only (default): ROS 2 nodes are exposed as Apps. A single host-level Component is created from system info. Namespace prefixes create Functions that group related Apps.
Hybrid: Manifest defines Areas/Components/Apps/Functions, runtime links them to live ROS 2 nodes.
Manifest-only: Only manifest-declared entities are exposed.
Areas are created from manifest only - they are never auto-generated in
runtime mode. Omit the areas: section in the manifest for a flat tree.
See Manifest-Based Discovery for details on manifest mode.
Important
If you are upgrading from a previous version, the entity model has changed significantly. Synthetic Areas and per-namespace Components are no longer created. See Breaking Changes for details and migration guidance.
In this tutorial, we use runtime-only mode with demo_nodes.launch.py.
List all functions:
curl http://localhost:8080/api/v1/functions
With demo_nodes.launch.py, you’ll see Functions like powertrain, chassis, and body
(created from the first namespace segment).
List all components:
curl http://localhost:8080/api/v1/components
In runtime mode, you’ll see a single host-level Component.
List all areas:
curl http://localhost:8080/api/v1/areas
In runtime mode, this returns an empty list. Areas require a manifest definition (see Manifest-Based Discovery).
Step 4: Read Sensor Data
The data endpoints let you read topic data from apps.
Read all data from an app:
curl http://localhost:8080/api/v1/apps/temp_sensor/data
Response structure (showing one topic):
{
  "items": [
    {
      "category": "currentData",
      "id": "/powertrain/engine/temperature",
      "name": "/powertrain/engine/temperature",
      "x-medkit": {
        "ros2": {
          "direction": "publish",
          "topic": "/powertrain/engine/temperature",
          "type": "sensor_msgs/msg/Temperature"
        },
        "type_info": {
          "default_value": {
            "header": {},
            "temperature": 0,
            "variance": 0
          },
          "schema": {
            "properties": {
              "header": {},
              "temperature": {"type": "number"},
              "variance": {"type": "number"}
            },
            "type": "object"
          }
        }
      }
    }
  ],
  "x-medkit": {
    "entity_id": "temp_sensor",
    "total_count": 3
  }
}
Each data item includes:
category: Type of data (currentData)idandname: ROS 2 topic pathx-medkit.ros2: Topic metadata (direction, type)x-medkit.type_info.schema: JSON Schema for the message typex-medkit.type_info.default_value: Default message structure
Read a specific topic:
curl http://localhost:8080/api/v1/apps/temp_sensor/data/powertrain%2Fengine%2Ftemperature
Response with live data:
{
  "data": {
    "header": {
      "frame_id": "engine",
      "stamp": {"sec": 1769955040, "nanosec": 286555163}
    },
    "temperature": 93.5,
    "variance": 0.5
  },
  "id": "/powertrain/engine/temperature",
  "x-medkit": {
    "entity_id": "temp_sensor",
    "timestamp": 1769955039964403368,
    "ros2": {
      "topic": "/powertrain/engine/temperature",
      "type": "sensor_msgs/msg/Temperature"
    },
    "publisher_count": 1,
    "subscriber_count": 0,
    "status": "data"
  }
}
Notice:
data: The actual message content from ROS 2 topicx-medkit.timestamp: Gateway capture time (nanoseconds since epoch)publisher_count/subscriber_count: Number of publishers/subscribers on this topic
Note
Topic paths use URL encoding: / becomes %2F
✅ Checkpoint
You should see:
Functions like
powertrain,chassis,body(from namespace segments)A single host-level Component (from system info)
Live topic data with actual sensor readings
Step 5: Call Services and Actions
The operations endpoints let you call ROS 2 services and actions.
List available operations:
curl http://localhost:8080/api/v1/apps/calibration/operations
Call a service (synchronous execution):
Services return immediately with status 200 OK:
curl -X POST http://localhost:8080/api/v1/apps/calibration/operations/calibrate/executions \
  -H "Content-Type: application/json" \
  -d '{}'
Response (200 OK):
{
  "parameters": {
    "success": true,
    "message": "Engine calibrated successfully (count: 1)"
  }
}
The parameters field contains the service response data directly.
Send an action goal (asynchronous execution):
Actions return 202 Accepted immediately with an execution ID for polling:
curl -X POST http://localhost:8080/api/v1/apps/long_calibration/operations/long_calibration/executions \
  -H "Content-Type: application/json" \
  -d '{"parameters": {"order": 5}}'
Response (202 Accepted):
{
  "id": "a1b2c3d4-e5f6-7890-abcd-ef1234567890",
  "status": "running"
}
Poll action status:
curl http://localhost:8080/api/v1/apps/long_calibration/operations/long_calibration/executions/a1b2c3d4-e5f6-7890-abcd-ef1234567890
Cancel a running action:
curl -X DELETE http://localhost:8080/api/v1/apps/long_calibration/operations/long_calibration/executions/a1b2c3d4-e5f6-7890-abcd-ef1234567890
Returns 204 No Content on success.
Step 6: Manage Parameters
The configurations endpoints expose ROS 2 parameters.
List all parameters:
curl http://localhost:8080/api/v1/apps/temp_sensor/configurations
Get a specific parameter:
curl http://localhost:8080/api/v1/apps/temp_sensor/configurations/publish_rate
Set a parameter value:
curl -X PUT http://localhost:8080/api/v1/apps/temp_sensor/configurations/publish_rate \
  -H "Content-Type: application/json" \
  -d '{"value": 5.0}'
Reset to default:
curl -X DELETE http://localhost:8080/api/v1/apps/temp_sensor/configurations/publish_rate
Step 7: Monitor Faults
Note
Requires ros2_medkit_fault_manager to be running.
List all system faults:
curl http://localhost:8080/api/v1/faults
List faults for a specific component:
curl http://localhost:8080/api/v1/apps/lidar_sensor/faults
Clear a fault:
curl -X DELETE http://localhost:8080/api/v1/apps/lidar_sensor/faults/LIDAR_CALIBRATION_REQUIRED
✅ Checkpoint
At this point you’ve successfully:
Discovered the ROS 2 system structure
Read sensor data via REST API
Called services and managed actions
Managed node parameters
Queried and cleared faults
🎉 You’re ready to explore the web UI and advanced features!
Using with Web UI
A companion web UI is available for visual entity browsing:
docker pull ghcr.io/selfpatch/ros2_medkit_web_ui:latest
docker run -p 3000:80 ghcr.io/selfpatch/ros2_medkit_web_ui:latest
Open http://localhost:3000 and connect to the gateway at http://localhost:8080.
See Web UI (ros2_medkit_web_ui) for more details.
Using with LLMs (MCP)
Connect your LLM to the gateway using ros2_medkit_mcp:
Option 1: Docker (recommended)
# Pull and run HTTP server on port 8765
docker run -p 8765:8765 \
  -e ROS2_MEDKIT_BASE_URL=http://host.docker.internal:8080/api/v1 \
  ghcr.io/selfpatch/ros2_medkit_mcp:latest

# Or run with stdio transport
docker run -i \
  -e ROS2_MEDKIT_BASE_URL=http://host.docker.internal:8080/api/v1 \
  ghcr.io/selfpatch/ros2_medkit_mcp:latest stdio
Option 2: Poetry (for development)
git clone https://github.com/selfpatch/ros2_medkit_mcp.git
cd ros2_medkit_mcp
poetry install
poetry run ros2-medkit-mcp-stdio
See MCP Server for LLM Integration for Claude Desktop and VS Code integration.
Using with Postman
For interactive API testing, import our Postman collection:
Import
postman/collections/ros2-medkit-gateway.postman_collection.jsonImport
postman/environments/local.postman_environment.jsonSelect “ROS 2 Medkit Gateway - Local” environment
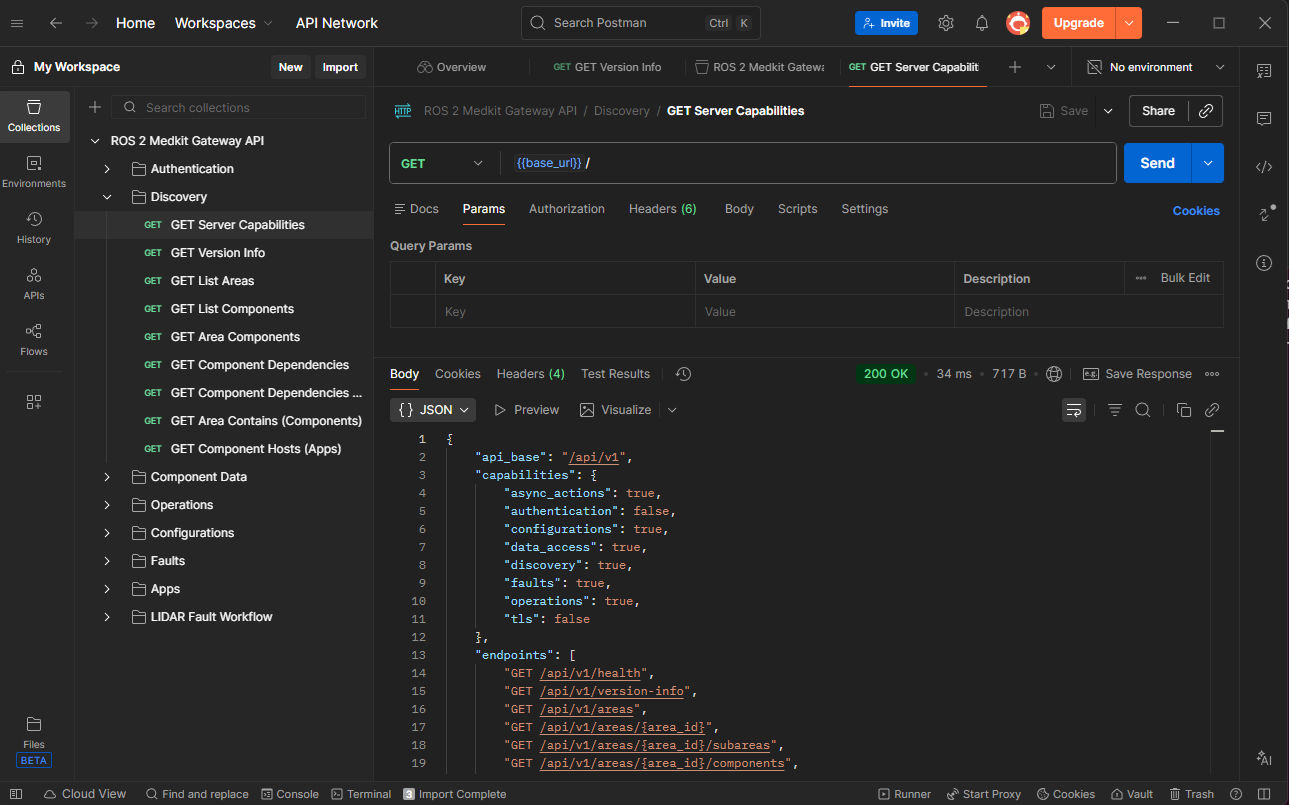
Postman collection with organized endpoint folders.
See postman/README.md for detailed instructions.
Next Steps
Configuration:
Server Configuration - Server, CORS, and TLS settings
Discovery Options Reference - Discovery mode configuration
Tutorials:
Configuring Authentication - Enable JWT authentication
Configuring HTTPS/TLS - Configure TLS/HTTPS
Manifest-Based Discovery - Use manifests for stable entity IDs
Docker Deployment - Deploy with Docker
Companion Projects:
Web UI (ros2_medkit_web_ui) - Visual entity browser
MCP Server for LLM Integration - LLM integration via MCP
Reference:
REST API Reference - Complete REST API reference
ros2_medkit_gateway - Architecture deep-dive